DEMOGRAPHIC ANALYSIS
The Nazareth Area is home to a diverse population of 52,431 people—young and old, wealthy and impoverished, working and non-working. Understanding the different types of people living in the Nazareth Area communities is a key component to identifying the needs of current and future residents and how those needs could be addressed in the multi-municipal comprehensive plan.
The Demographic Analysis section paints a picture of who is living in the Nazareth Area and how many more people are projected to come by 2040. This data will be compared to the data analyses to follow to inform the goals, policies and actions to be included in the multi-municipal comprehensive plan. The plan will be designed to manage growth in the Nazareth Area and help make decisions that best serve the communities.
Population
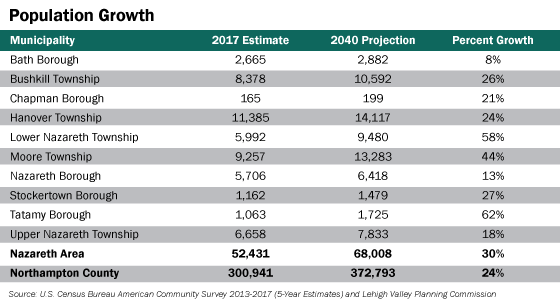
The Nazareth Area is home to approximately 17% of Northampton County’s population—a small percentage considering the land size of the Nazareth Area. That population is projected to increase to 18% by 2040, indicating a faster growth than other areas of the County. All municipalities are expected to grow, with Tatamy Borough and Lower Nazareth Township experiencing the largest amount of growth. Based on past and current trajectories of regional population growth, the increases of Tatamy Borough and Lower Nazareth Township could be due to close proximity to development growth along the Route 33 corridor, although this does not explain why Nazareth and Stockertown boroughs and Upper Nazareth Township are projected for lesser (although still significant) rates of growth.
Birth and Death Rate
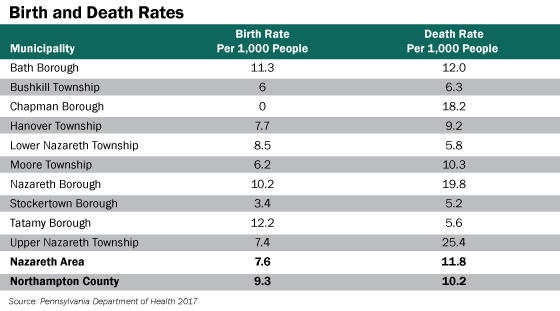
Birth and death rates indicate what proportion of population increase is attributed to natural increase (parents giving birth to children), compared to in-migration. The Nazareth Area has an overall birth rate of 7.6 children per 1,000 people per year and a death rate of 11.8 people per 1,000 people per year. These rates differ from the national rates of 18.5 births and 7.8 deaths per 1,000 people each year (based on 2016 data). This indicates that while national population growth is due to natural increase, population growth locally is attributed to the migration of people into the Nazareth Area.
However, this conclusion does not necessarily apply to each individual municipality. Tatamy Borough has the highest birth rate and a significantly lower death rate compared to other communities. This means that the projected growth of Tatamy Borough is partially due to natural increase and indicates a larger proportion of young families residing in the Borough. Conversely, Chapman Borough has a birth rate of 0 and a death rate of 18.2 persons per 1,000 people, which suggests a higher proportion of seniors and a lower proportion of younger adults.
Age
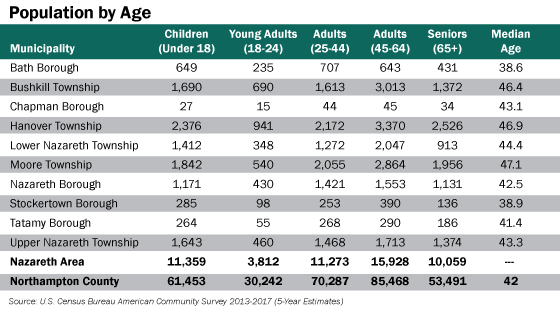
The Nazareth Area has a balanced population of diverse ages. The age groups of children, adults 25-44 and seniors each make up relatively equal proportions of close to one-fifth of the population, with Adults 45-64 making up a larger percentage of the population, close to one-third.
The proportion of Young Adults is significantly lower compared to the rest of the segments of the population, at only 7.3%. This may suggest that a large number of students move away from home to attend college, although there is indication that they return to the area to work, based on the Adults population overall (25-64), which makes up 50% of the total population.
Education
Attainment
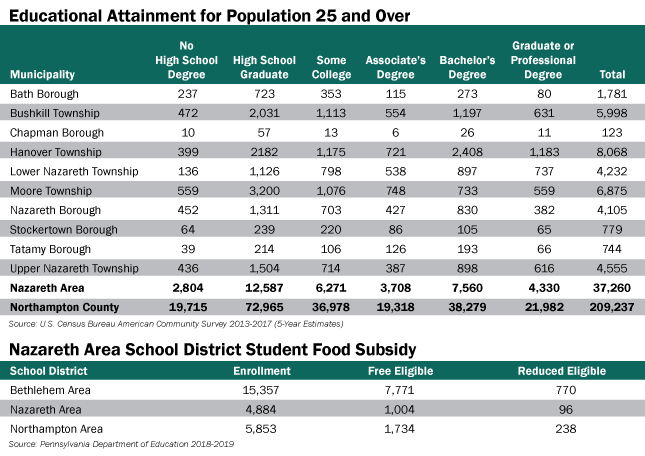
Roughly one-third (31.9%) of the Nazareth Area population over the age of 25 has a bachelor’s, graduate or professional degree, which is on par with Northampton County (30%). An additional 10% have obtained an associate's degree. Just more than one-third list a high school diploma as their highest education level, leaving 7.5% of adults listing no formal education. This data indicates a diverse educational attainment of people living in the Nazareth Area, which likely translates to diverse incomes and housing attainment ability.
Student Food Subsidy 2018-2019
To examine the number of students eligible for lunch subsidies, data was obtained from the Pennsylvania Department of Education. It is important to note that the Nazareth Area School District is the only district containing exclusively Nazareth Area municipalities. The Bethlehem Area School District was included because it contains Hanover Township students, and the Northampton Area School District contains students from Bath and Chapman boroughs and Moore Township. The exact number of Nazareth Area students in the Bethlehem Area and Northampton Area school districts is unknown because the districts do not report the portion of students from each community.
Within the Nazareth Area School District, one-fifth of the student body is eligible for free lunch, compared to almost one-third in the Northampton Area and half in the Bethlehem Area school districts. Bethlehem Area and Northampton Area school districts have a significantly smaller proportion of students eligible for reduced lunch (about 5% and 4%, respectively) than free lunch, although the Nazareth Area School District rate is still lower at 2%.
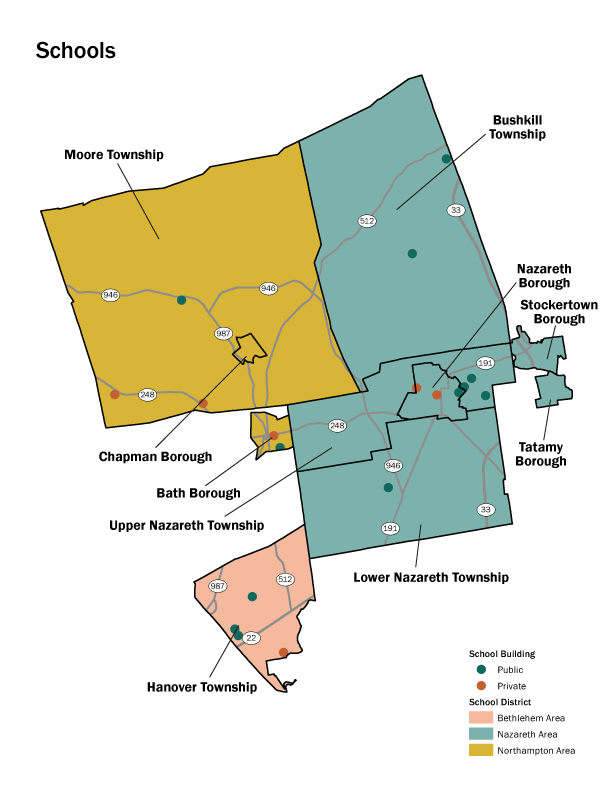
Schools
The Nazareth Area is covered by the Nazareth Area School District, plus portions of the Northampton Area and Bethlehem Area school districts.
Labor Force and Unemployment
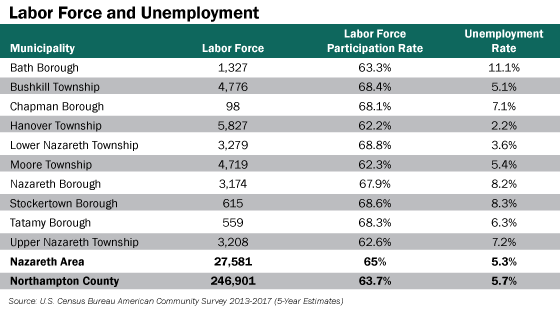
The U.S. Census Bureau classifies “labor force” as all people over the age of 16 that have a job or are actively looking for a job. The labor force participation rate identifies what percentage of the total population is in the labor force, and the unemployment rate identifies what percentage of the labor force is not employed and seeking a job.
All Nazareth Area communities have a labor participation rate close to two-thirds of the population over 16 years old, but their unemployment rates vary, ranging from a low of 2.2% in Hanover Township to a high of 11.1% in Bath Borough. Overall, the Nazareth Area has a rate of 35% of the population not in the labor force, which is in line with the proportion of young adults and seniors in the area. Although the Nazareth Area has an overall unemployment rate (5.3%) that is on par with Northampton County’s rate of 5.7%, many of the communities have rates that are much higher than the County average.
Income and Poverty
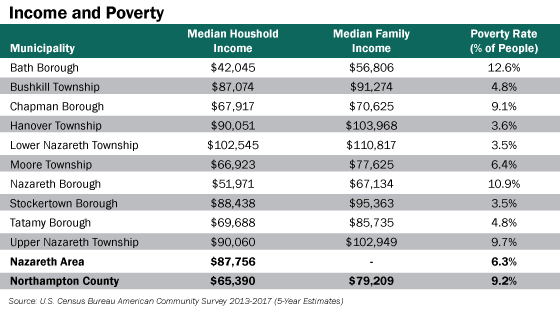
The Nazareth Area overall median household income of $87,756 is well above the $65,390 median household income of Northampton County. The median household income of Nazareth Area communities varies significantly, ranging from $42,045 in Bath Borough to $102,545 in Lower Nazareth Township.
The difference between household and family incomes is caused by the makeup of the household. Family households have two or more people with incomes to support multiple people. Non-family households include single-person households and are likely to contain individuals that are very young or elderly, often with lower incomes than families. A community with a wide disparity between household and family income is likely to have a high proportion of non-family households. Bath, Nazareth and Tatamy boroughs, as well as Hanover, Moore and Upper Nazareth townships, all have household-to-family income disparities of greater than $10,000.
The Nazareth Area has an overall poverty rate of 6.3%, which is significantly lower than the Northampton County rate of 9.2%. Many boroughs, including Bath and Nazareth, have relatively high poverty rates, and many of the townships have relatively low poverty rates. However, the relation of poverty to certain geographies (e.g., population density) may not indicate causation, but it provides information to municipal officials as to what areas may have the greatest need for investment.
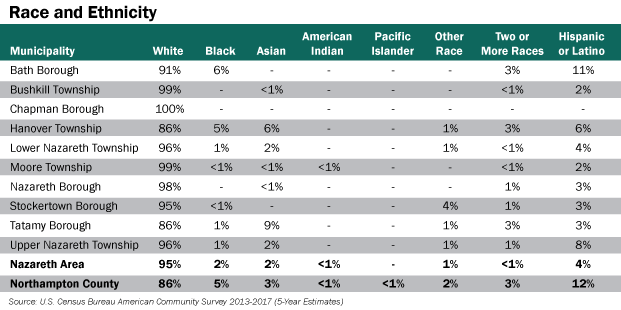
Race and Ethnicity
The U.S. Census Bureau categorizes “race” as self-identification with one or more social groups. Census respondents can select a single race they identify with (White, Black, Asian, Native American, Pacific Islander, other) or they can select that they identify with two or more races. Ethnicity is a separate category from race and identifies whether or not a person is of Hispanic or Latino origin. The Census Bureau has two categories for ethnicity—Hispanic or Latino and Not Hispanic or Latino. Therefore, a Census survey respondent can identify their race (for example, White) and also identify whether or not they are of Hispanic or Latino origin.
The residents of the Nazareth Area predominantly identify as White racially, though there are a few municipalities that have significant non-White populations. A small proportion of Tatamy Borough’s residents are Asian, and a small proportion of Bath Borough residents are Black. Hanover Township has small proportions of Black and Asian residents, relative to its total population. While the Township’s Black and Asian residents make up a very small portion of the overall Nazareth Area population, they represent a majority of the Black and Asian populations in the ten-community region.
Hispanic and Latino populations make up the nation’s largest minority, and that trend toward diversity is seen in the Lehigh Valley as well. In the Nazareth Area, Bath Borough has the largest proportion of Hispanics or Latinos, nearly on par with the percentage for Northampton County. Upper Nazareth Township and Hanover Township have the next greatest Hispanic or Latino populations, and the Nazareth Area overall is home to 6% of the Hispanic or Latino population in Northampton County.
Since 2010, the Nazareth Area overall has experienced a 2% increase in the proportion of the population that identifies as White. The Nazareth Area has also experienced a 1% increase in the proportion of the Hispanic or Latino population, while the County as a whole saw a 2% increase.
Equity
Equity refers to whether or not all people in various geographies have access to housing, education, employment and transportation resources that are essential for a high quality of life. An equitable community is more culturally vibrant and economically successful because there are more hands and brains contributing to the betterment of the area.
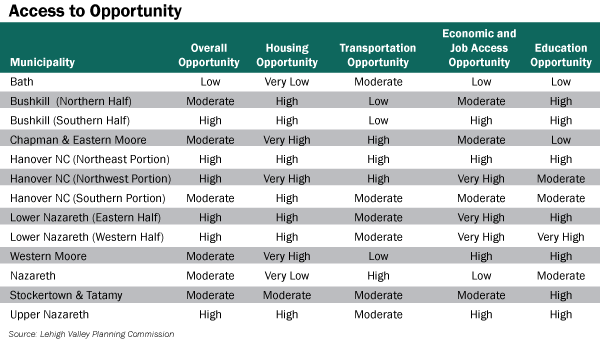
The LVPC completed an Equity Analysis in 2018 to identify what areas of the Lehigh Valley have high or low access to opportunity relative to the rest of the region. The analysis looked at 14 different data points related to housing, transportation, economics and job access, and education. Based on the scoring of these data points, each census tract is given a score from very low to very high access.
The 2018 analysis was re-calculated based on the Nazareth Area geography exclusively to see how opportunity compares between Nazareth Area communities. Based on these results, it was found that opportunity is not evenly distributed throughout the area. Bath Borough was found to have low overall access to opportunity relative to the rest of the Nazareth Area. The remaining boroughs, as well as northern Bushkill Township, Moore Township and a portion of Hanover Township, have moderate access compared to the high access found in the rest of the townships. The low score in Bath Borough was due to very low levels of access to housing and low access to education and economic and job opportunities. Nazareth Borough also scored very low in the housing category. Several of the communities scored well for transportation opportunity, although this may be because the data used in the analysis relies primarily on vehicle use and does not account for multimodal connectivity.
In the original 2018 analysis, the Nazareth Area overall was found to have either high or very high access to opportunity, compared to the Lehigh Valley as a whole. This was largely due to the Nazareth Area’s relatively high homeownership rates, vehicle access, proximity to jobs, high preschool enrollment rates, a low percentage of people paying more than 30% of their income for housing and low vacancy rates. Opportunity factors that rated the Nazareth Area lower than other Lehigh Valley geographies included moderate commute times (close to 30 minutes on average), unemployment and educational attainment rates.
Internet Access
The Nazareth Area is well-connected by internet access, with a high proportion of the population having broadband connectivity. About 17% of the population does not have any access to internet, which typically is the case in more rural townships, but may also be true for Chapman or Bath boroughs. Continuing to strengthen internet access will be important for the area to compete in an increasingly global economy.

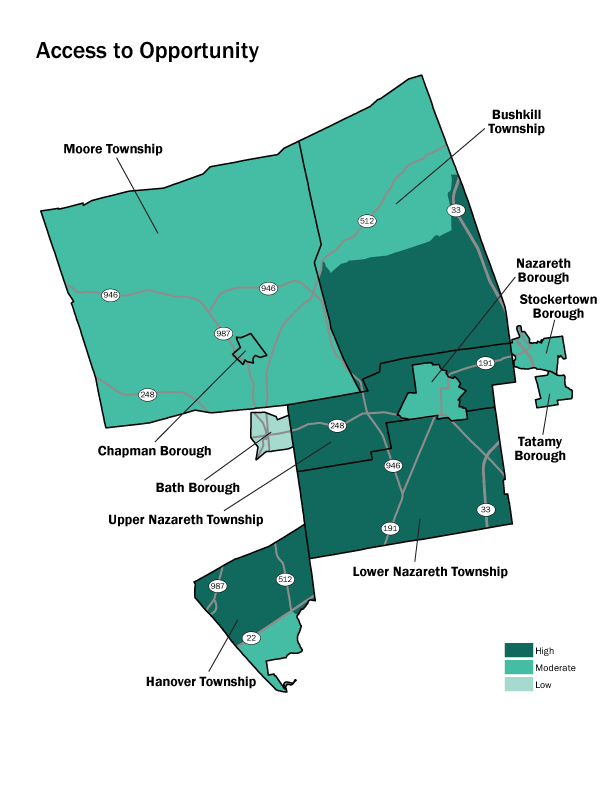
Access to Opportunity
Overall, the Nazareth Area has moderate or high access to opportunity. However, that access is not distributed evenly across the municipalities.
Summary
The Nazareth Area is growing, with demographic data showing a wide range of incomes and educational attainment among the population. With a birth rate smaller than the death rate, the future growth of the Nazareth Area is expected to be due to in-migration. The projected increase of 15,577 people by the year 2040 will need to be provided for with attainable housing and job opportunities within reasonable commutes, both within and outside of the Nazareth Area.
Understanding who lives in the Nazareth Area is critical for the multi-municipal comprehensive plan in developing goals, policies and actions for the betterment of all residents in the area. The Nazareth Area is not as diverse in terms of race and ethnicity as Northampton County as a whole. Compared to 2010, the Nazareth Area is less diverse racially now, with a 2% increase in the White population, while the Hispanic or Latino population over the same time period increased by just 1%. It is not clear how this may be influenced by in-migration over the planning period.
Providing equitable access to housing, transportation, education and jobs is vital to a more productive and sustainable region. While many portions of the Nazareth Area exhibit high levels of access to opportunity, some denser areas, such as in the boroughs, require greater investment to increase access to opportunities for all residents. For example, Bath Borough was found to have the least access to opportunity in the Nazareth Area.
Identifying areas of lower opportunity alone is not enough to tell the whole story of the Nazareth Area or to determine what investments are needed. However, when compared to the Housing, Economic, Land, Development and Redevelopment Opportunities and Transportation analyses to follow, the demographic data and analyses will enable a thoughtful pathway towards logical management of the Nazareth Area’s future growth.