
HOUSING ANALYSIS
The Nazareth Area has been growing in population in recent years, as development continues to spread outward from the cities and northward along the Route 33 corridor. Population projections indicate that this growth will continue at a significant rate over the next 20 years, putting pressure on the Nazareth Area to provide sufficient housing options.
The multi-municipal comprehensive plan will need to examine how best to balance growth to accommodate new residents without losing the area’s character and quality of life.
The Housing Analysis examines the current conditions of the housing stock and market in the Nazareth Area. The analysis focuses on four main elements: current housing stock, recent construction and renovation, attainability, and recent sales. These analyses are based on publicly available data regarding building type, age, occupancy, value and sales from the United States Census, Northampton County and the Lehigh Valley Planning Commission. The results were compared to local perceptions about history, attainability and market conditions to form a cohesive understanding of the housing market in the Nazareth Area.
Supply and Demand
Current Housing Supply
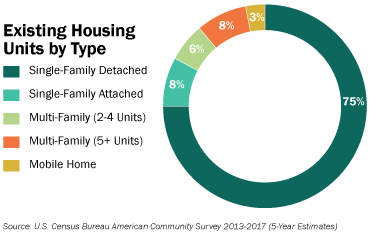
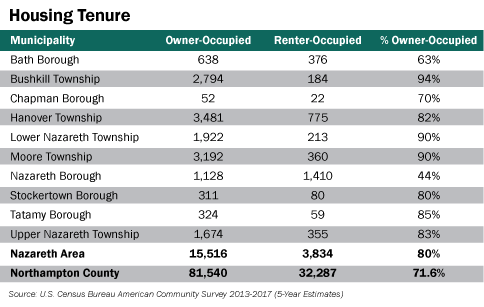
The housing stock in the Nazareth Area is predominantly made up of single-family homes. The vast majority of these houses are detached, with a small number of twins, rowhomes, duplexes, apartment buildings and mobile homes. The area has a high percentage of homeowners, nearly 10% more than Northampton County. Overall, the Nazareth Area boroughs and townships have very similar homeownership rates, however, Bath, Chapman and Nazareth boroughs have significantly lower rates of homeownership, with the majority of the Nazareth Borough population consisting of renters.
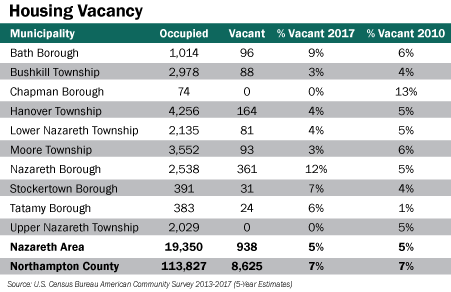
Overall, the Nazareth Area’s vacancy rate of 5% is lower than the vacancy rate of Northampton County and the Lehigh Valley. The vacancy rates of individual communities range from no vacancies in Chapman Borough and Upper Nazareth Township, to moderate levels of vacancy in the other boroughs and townships. Nazareth and Bath boroughs have significantly higher vacancy rates. Six municipalities have rates that have fallen over the last ten years. Vacancy in Chapman Borough has been greatly reduced, while Nazareth, Tatamy, Stockertown and Bath boroughs’ vacancy rates have increased. These rates point to different conditions in individual community’s housing markets and may be reflective of how many properties were for sale at the time, rather than long-term trends that need to be addressed.

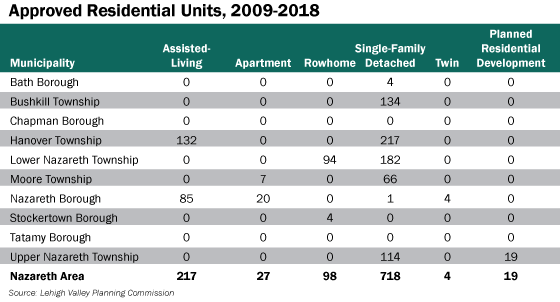
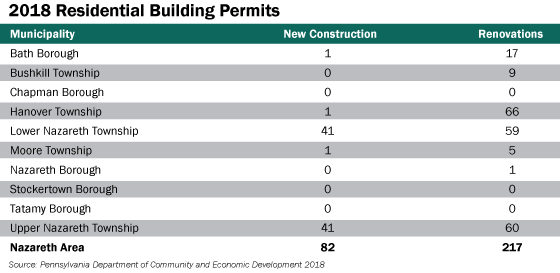
The Nazareth Area has added about 10% to 15% of its existing housing stock every decade since the 1960’s, with just under one-fifth of the existing housing stock built prior to 1939. Because the majority of housing units are relatively new, it is likely that these units are in good condition. The momentum of housing construction per decade drops off in 2010, although this may be due to limitations of available data. The Nazareth Area has seen a total of 1,083 residential units approved in the last ten years, of which 20% are assisted-living units and 66% are single-family detached homes.
Building permit data shows a number of renovation projects in 2018, indicating that people are making significant investments in their homes alongside new construction.
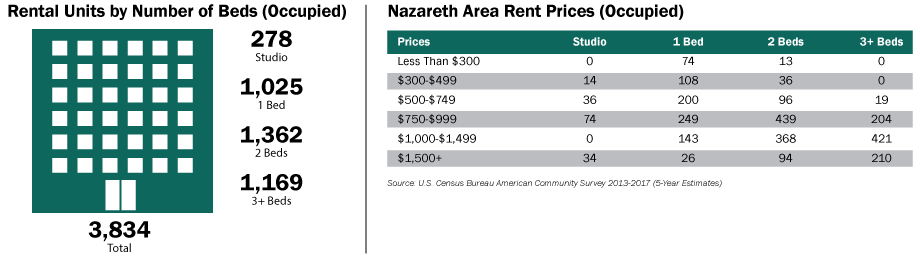
The rental market in the Nazareth Area has a fairly even balance of one-, two- and three-bedroom occupied units, available at a range of rental price points. This indicates an available supply for residents with varying income levels, with significantly more units available above the $750 price point. Studio and one-bedroom units make up the bulk of apartments below $750 per month, but their supply is much more limited. This may indicate potential to add housing for low- and moderate-income households—a common problem for both seniors and young adults in the greater Lehigh Valley.
Current Housing Demand
The household income data shows a diverse range of household incomes in the Nazareth Area, with 51% of households earning just over or under the Area Median Income (AMI) of $87,756. This puts most of the potential housing demand between approximately 85.5% and 156% of the AMI, where there is also the greatest supply of housing in the region. However, there are also a significant number of households with moderate and low incomes. About 13% of households earn less than $25,000 per year, which is below a livable wage for a single adult with no children. Approximately one-third of households earn less than the $50,000 a year livable wage for a single adult with one child. A lack of housing for people in these thresholds means that many low- and moderate-income households may have to reach into the higher, more costly housing market levels to be able to live in the area.
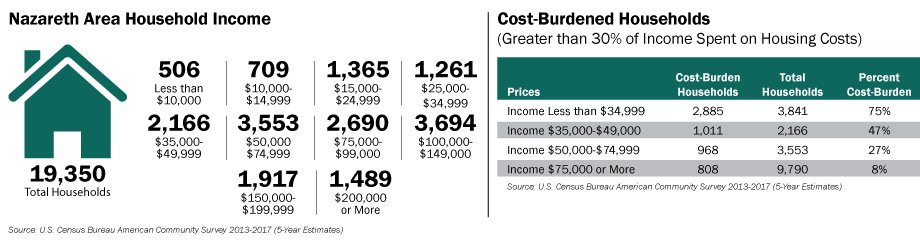
Nearly one-third of the Nazareth Area population is housing cost-burdened, meaning that those households spend greater than 30% of their income on housing. However, the rate of cost-burdened households is not evenly distributed across all income levels. Nearly two-thirds of households earning below $50,000 are cost-burdened. This shows how a limited supply of lower-cost housing is making housing attainability difficult for lower-income households in the Nazareth Area.
Note that the 30% threshold is a widely accepted standard for measuring cost burden and attainability. Many households choose to spend well below 30% of their income on housing, and many view spending anywhere near 30% of their income as being unaffordable. The 30% threshold is treated as the maximum households should spend on housing.
Housing Attainability Analysis
Methodology
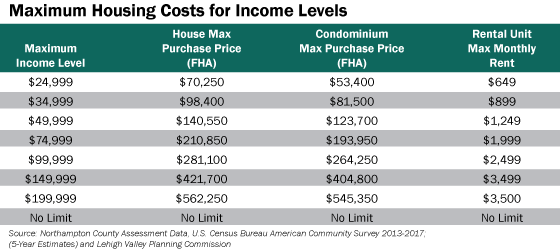
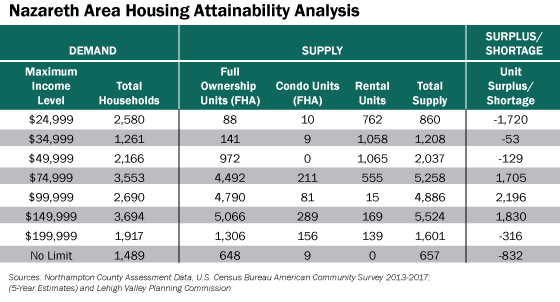
The attainability analysis brings housing supply and demand together in a side-by-side comparison to determine whether there is a surplus or shortage of attainable housing units within each income level. The assessed value of all properties was converted to a market value price to determine their realistic selling price.
Note: Finding Market Value – To approximate current market value, a multiplier was calculated to find the conversion rate between the assessed property value and market price. Using all properties that have sold in the last five years (2014-2018), the multiplier was calculated to be 3.6. The assessed value of all properties was multiplied by this factor to find an estimated current market value.
Property value assessments have not been updated recently and were significantly lower than market value. The assessed value of all properties was converted to a market value price to determine their realistic market price. While the model is representative of general housing costs in the Nazareth Area, a new county assessment would significantly improve the understanding of current conditions in housing attainability.
The calculated market values of these existing homes were used to determine the maximum purchase price (not exceeding 30% of pre-tax income) of houses and condominiums, as well as the maximum rent price, for each income level. For house and condominium units, a Federal Housing Administration (FHA) mortgage was assumed as a 30-year loan at a rate of 4.6% interest. The factors of the mortgage calculation included a down payment, insurance, real estate taxes, and for condominiums, an annual maintenance fee. Calculations were performed for income ranges expressed as a percentage of $87,756, the median household income for the Nazareth Area, referred to as the Area Median Income (AMI).
Findings
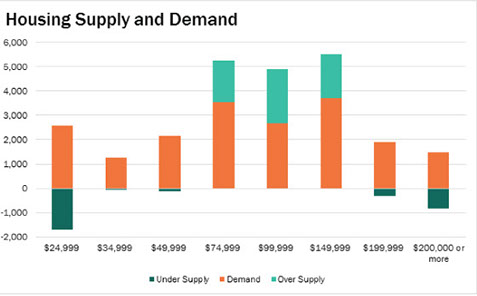
Based on the Housing Attainability Analysis, there is an overall surplus of 2,681 housing units in the Nazareth Area, with a 37% surplus of units for households earning between $50,000 and $150,000 gross annual income. This leaves a deficit at the far lower and upper ends of the income spectrum, with a 51% deficit in the upper end. This indicates that some high-income households are having to “buy down” into the middle market for housing, resulting in an actual 29% surplus of middle-market units. The unit deficit of 46% at the lower end results in many low-income households having to “buy up” into the middle market and thus becoming cost-burdened.
While there appears to be plenty of available housing in the middle market (85.5%-156% AMI), this price point may not contain desirable housing types for all people. The lower ranges of the market (below 57% AMI) contain the majority of the Nazareth Area’s rental units, indicating the potential for the market to add middle- and higher-end rental units to meet upper-income demands. Conversely, the majority of the Nazareth Area’s housing units are priced in the middle- to higher-end market (85.5% AMI or above), indicating a need for houses at attainable price points for households earning below $50,000 per year.
There are several reasons why there may not be as many higher-priced housing units in the Nazareth Area. This could be because more people in these income brackets choose to buy less expensive homes and renovate them or because the age of the housing assessment data under-valued more expensive homes. It could also be that higher-income households do not want to spend more on housing.
Note that the apparent overall surplus of 2,681 housing units would correspond with about a 13% housing vacancy rate—about 2.5 times the census vacancy rate. This is likely the result of comparing demand from census data and supply from the Northampton County assessment data.
Note that the demand is based on number of households within each income bracket. Supply is based on the number of housing units that are attainable using 30% of the maximum income of each bracket.
Housing Market Trends
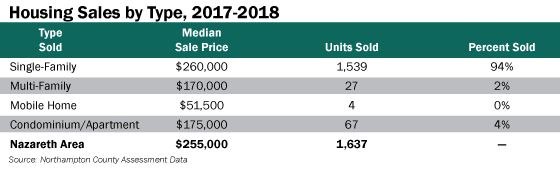
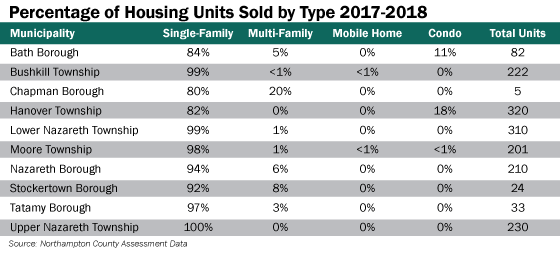
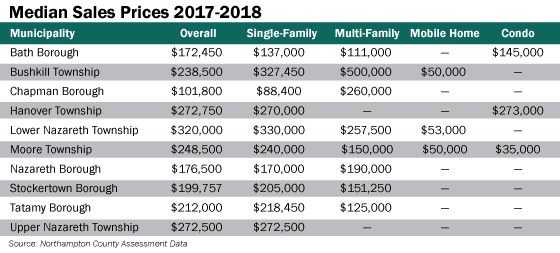
Single-family housing has dominated home sales in the Nazareth Area for the period of 2017-2018. The median price for these sales is suitable for the greatest demand in the area, at $260,000 (between 85.5% and 114% AMI). This median sales price aligns with the median household income and would be considered attainable.
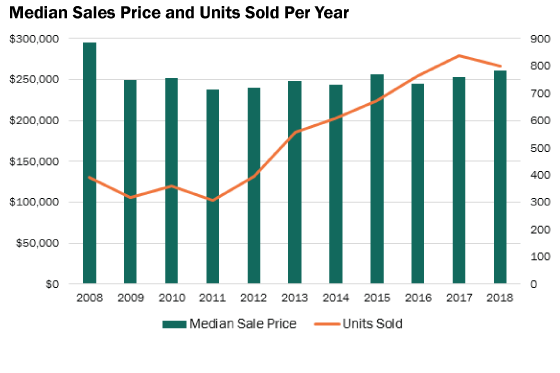
Home sales steadily climbed since 2011, shortly after the economic recession ended, until a slight downturn in 2018, showing an overall growing demand within the Nazareth Area. Many individual municipalities have also seen an upward trend in sales volume over the last ten years. Bushkill, Hanover, Lower Nazareth, Moore, and Upper Nazareth townships, as well as Nazareth Borough, have seen the most significant increase in sales, with more modest increases in Bath, Stockertown and Tatamy boroughs.
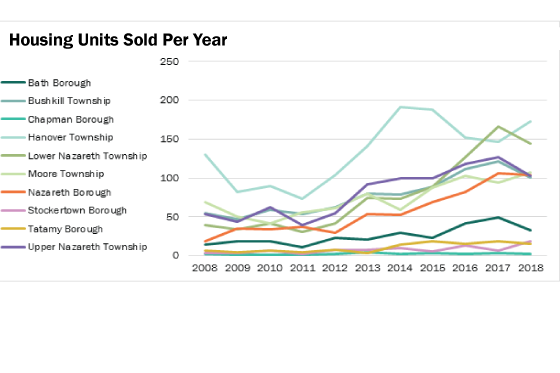
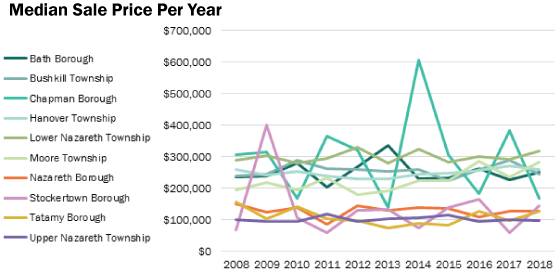
Median sale prices have been less predictable on the municipal level, although the more highly variable year-to-year prices are attributable to municipalities that have smaller datasets. Overall, the Nazareth Area municipalities have retained their same median sales prices over the last 11 years.
Single-family homes dominate the market in the Nazareth Area, although multi-family homes make up a small percentage of housing sales in the boroughs. This is likely due to increased density in those areas.
Median sales prices vary significantly between individual municipalities. Chapman Borough has the lowest overall and single-family median prices. Bath and Nazareth boroughs have the lowest median sales prices overall. Lower Nazareth Township has the highest median sales price overall.
Several of the municipalities, including Bushkill Township, Chapman Borough and Nazareth Borough have higher median sales prices for multi-family housing than for single-family. While this may seem unusual, it is quite common in areas with strong demand for rental housing, as the extra income from the additional units can help pay for a higher mortgage.
Future Housing Growth
LVPC population projections predict that Nazareth Area population will grow significantly over the next 20 years. This increase is due to overall growth within the Lehigh Valley and less potentially developable land in areas that have accommodated growth over the last several decades, as well as a growing economy in the Nazareth Area.
This new population will require significant amounts of new housing. Using the current household formation rates (how many people per household on average) for each municipality, the Nazareth Area is estimated to need to accommodate 5,632 new households by 2040. To meet that need, the area would need to add about 282 new homes per year for the next 20 years—more than three times the current rate.

Summary
The Nazareth Area, along with the rest of the Lehigh Valley, has seen significant growth over the past ten years. While the American Community Survey 2013-2017 estimates a 5% vacancy rate in the area, the housing supply analysis reveals a surplus of 2,681 housing units, which is actually about a 13% vacancy rate. This is likely the result of comparing demand from census data and supply from the Northampton County assessment data. The attainability analysis indicates that development in the Nazareth Area has been keeping up with this growth, although the existing housing stock may not be appropriate for some Nazareth Area residents.
The analysis suggests that developers are over-producing units priced from around $140,000 to around $420,000 for houses and condominiums, and rental units priced between $1,250 and $3,500 per month. At the same time, a shortage of lower-priced units is causing households to “buy up” into the middle market. The majority of units priced at a lower cost are rentals, indicating the potential to increase the availability of lower-priced homes for sale.
As the Nazareth Area considers its future population and development growth, it will be necessary to examine how best to accommodate the diversity of people that currently reside in the area, as well as those that are still to come. Balancing this growth appropriately will be key to preserving and enhancing the character and quality of life of the Nazareth Area.